Bitcoin Bro
jonathanlimsc | 2023-01-11  Image generated via Stable Diffusion 2
Time-series prediction for Bitcoin (BTCUSDT) price, with data scraped from Binance API.
I’ve always been interested in applying ML techniques to algorithmic trading and wanted to build an end-to-end framework for extracting price data, generating features, training a model and running that model on real-time price data to test out trading strategies. I can then base future algorithmic trading techniques on this framework.
For this iteration of the project, I chose Binance API as the data source because it was publicly available without the need of an API key for the spot price reading, and BTCUSDT is a well-known ticker that has massive volume. There were also open-source Python connector libraries I could reference and adapt.
I used Streamlit to code and host my real-time dashboard as there were many pre-built components that I could use to build the dashboard quickly, and hosting on Streamlit Cloud simply required connection to my Github repository.
The focus of the project was on the end-to-end nature from data sourcing to live dashboarding for performance monitoring. In comparison, feature engineering and modelling was simple, and can be improved in the future.
I scoped this problem into a supervised regression task, where given all the features at a certain minute (single row of the feature dataframe), predict the next minute's price (that is the label).
Each given minute has features extending 30 days into the past, to predict the next minute’s price.
These were the features I built for the model: (notebook)
day_of_week: Mon-Sun (0-6)month_of_year: Jan to Dec (1-12)hr_of_day: 0-23quarter_of_hour: 1-4 corresponding to the quarters of an hourclose_5m_ma: average of the closing prices in the previous 5 minutesclose_30m_ma: average of the closing prices in the previous 30 minutesclose_1h_ma: average of the closing prices in the previous 60 minutes (1 hour)close_4h_ma: average of the closing prices in the previous 240 minutes (4 hours)close_12h_ma: average of the closing prices in the previous 720 minutes (12 hours)close_1d_ma: average of the closing prices in the previous 1440 minutes (24 hours)close_15d_ma: average of the closing prices of the previous 21600 minutes (15 days)close_30d_ma: average of the closing prices of the previous 43200 minutes (30 days)close_t_minus_[x]: previous closing price at t-x minutevolume_t_minus_[x]: previous volume at t-x minute
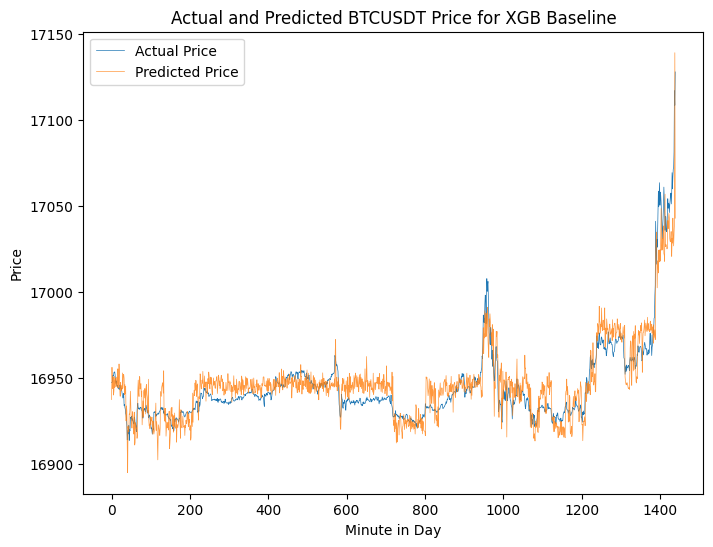
All minute-interval price data for BTCUSDT from 2021-03-01 to 2023-01-09 was scraped. 80:20 split for training and validation datasets, and 2023-01-09 prices (1440 datapoints) were used as the test set.
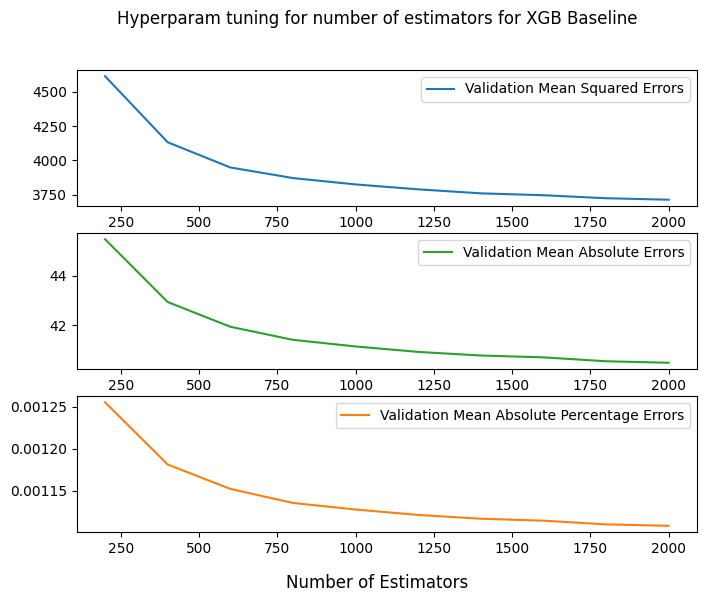
The model itself was a simple XGBoost model used as a performance baseline, to compare against future models. I did some hyperparameter tuning (notebook) on the n_estimators to achieve higher validation accuracy.
Hyperparameter tuning 
Performance on test set (2023-01-09 data) 
Real-time dashboard
The real-time dashboard actively pulls the minute-interval prices of the current day (UTC time), and thereafter generates features and predictions. Each day (1440 minutes) will therefore have a time-series of 1440 prices and predictions. A total of 4 trading strategies are run on the predicted price for that day, and profits cumulated.
Trading strategies
Strategy 1 Buy if predicted price for that minute is greater than the previous minute’s closing price. Sell on each minute’s closing price. This strategy will never allow holding of the asset beyond a minute.
Strategy 2 Buy if predicted price for that minute is greater than the previous minute’s closing price. Sell when that minute’s predicted price is greater than the buy price (buy price is assumed to be the closing price of the minute before the buy). Selling is only possible when a previous buy has taken place. This strategy allows holding of the asset across minutes, until the sell condition is triggered.
Strategy 3 Buy if predicted price for that minute is greater than the previous minute’s predicted price. Sell on close. This strategy will never allow holding of the asset beyond a minute.
Strategy 4 Buy if predicted price for that minute is greater than the previous minute’s predicted price. Sell when that minute’s predicted price is greater than the buy price (buy price is assumed to be the closing price of the minute before the buy). Selling is only possible when a previous buy has taken place. This strategy allows holding of the asset across minutes, until the sell condition is triggered.
Observations
The interesting thing is that even though the model was not trained on latest possible data (e.g. it was trained on data up till 2023-01-09 instead of being retrain daily, up to one day before present day), and even though the predicted time-series does not follow the “random walk” nature of the actual underlying price sequence, the strategies can still be profitable.
This is probably due to the fact that as long as the model can predict impending uptrend/downtrends in price, it will be able to capture some profits.
Future directions:
- More feature engineering
- Exponential averaging to weight recent prices more heavily
- Financial indicators such as RSI
- Financial News sentiment
- Tune XGBoost more on
max_depthsince there are 300+ features, a currentmax_depthof 5 is quite limiting. - Try out other models a) to take into account time-series trend / correlation / seasonality, and b) to predict longer sequences of time, rather than next-interval price
- ARIMA
- Vector Autoregression Model
- Pycaret
- Seq2seq models such as RNNs, LSTMs
- NeuralProphet
- Reinforcement learning
- Next-day price prediction